.png?height=120&name=rockcontent-branco%20(1).png)
In this support post, we will discuss how to use a lookup table and rules to display survey results to your respondents.
The Ion platform can be used to build interactive Survey experiences that prompt visitors to make a selection from a few choices. If you are building an experience that Surveys your audience for information, you may want to display how many visitors made the same selection on a Results page.
Survey Form
To get started, you will first want to set up your creative. Your creative will consist of at least two pages - one page with the survey and a second page showing the results.
On the survey page, you will add a freestyle form and add a choice group to your freestyle form. The choice group will be used for visitors' selections in your survey.
In our example, we will use a choice group with two choices that save values of Apples and Oranges, respectively to a data field called "Fruit". We will also use a choice group that only allows one selection to be made. We will also set our choices to send visitors to the Results page as soon as a selection is made by applying a form action to each choice.
Survey Lookup Table
After setting up your survey form, it’s time to create a lookup table that will be used to centralize the selections made by each visitor in a place that can be referenced by all other visitors. To create a lookup table:
- From within your console’s side nav, click the Data Management tab and select “Lookup tables”
- Click the "New lookup table” button
- Give your lookup table a title
- In this example, we will use “Survey Results” for the lookup table title
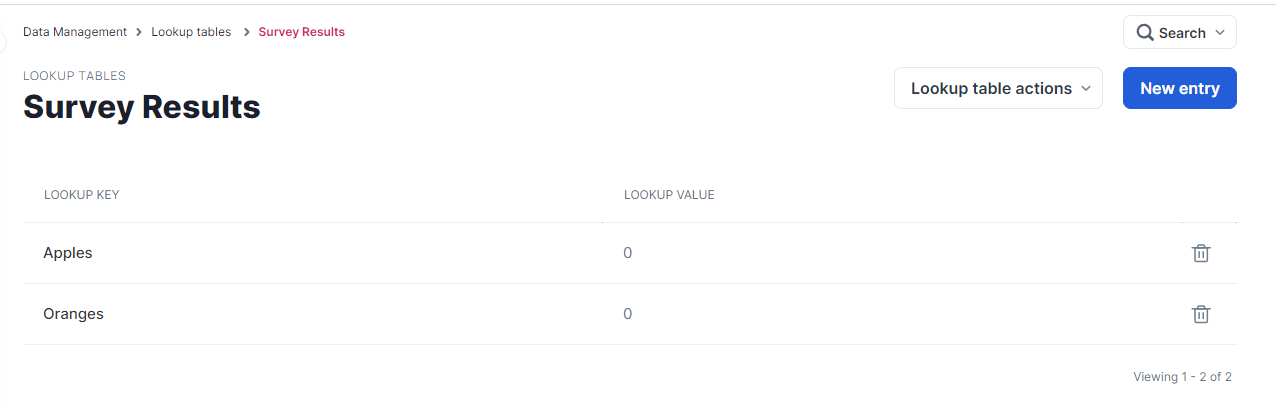
Next, add entries to your lookup table by clicking the “New entry” button. You will want to have one entry for each choice that can be made within your Survey.
Each time you add an entry, you will see a textbox for the “Lookup key” and another textbox for the “Lookup value.” For this setup, you will want to make the lookup key for each entry the value that is saved for each choice (i.e. Apples and Oranges) and use 0 for the lookup value.
Results Page
Once the lookup table is done, go back to your creative and click on the Results page to create rules and add content variables to display the results.
Rules
Page rules can be used to save data to the lookup table, increasing each entry's count as visitors make selections in real time. Page rules can also be used to read that data and save it to data fields which are then displayed on the page using content variables.
To add page rules, click the “+Rules” button in the Page tab of your creative studio. The rule that you create will reference the value saved to the “Fruit” field and add 1 to the corresponding entry within the lookup table (i.e. if they selected Apples, the Apples entry value would increase by 1) using the “Save computed data into lookup table” action.
Next, add actions to your rule to save the value currently stored in each entry into separate data fields using the “Read from lookup table” action. In our example, we will save to Apples and Oranges fields, respectively.
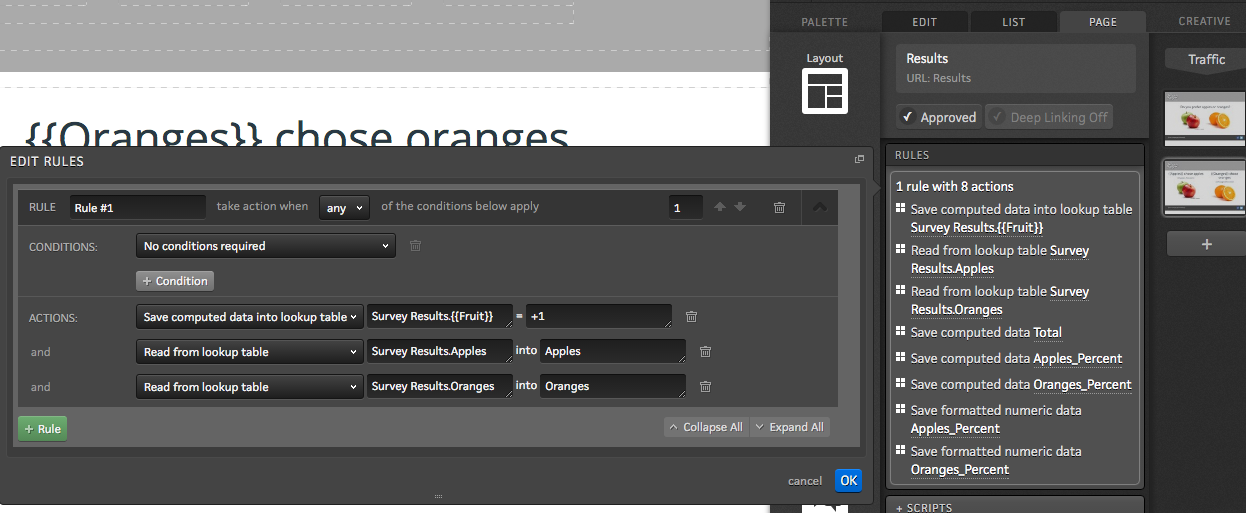
*NOTE: When referencing a lookup table, you will enter the name of your lookup table, a period, and then the lookup key (i.e. Survey Results.Apples). To dynamically reference a lookup key using the value saved to a given field, you would use a content variable instead of a specific lookup key (i.e. Survey Results.{{Fruit}}).
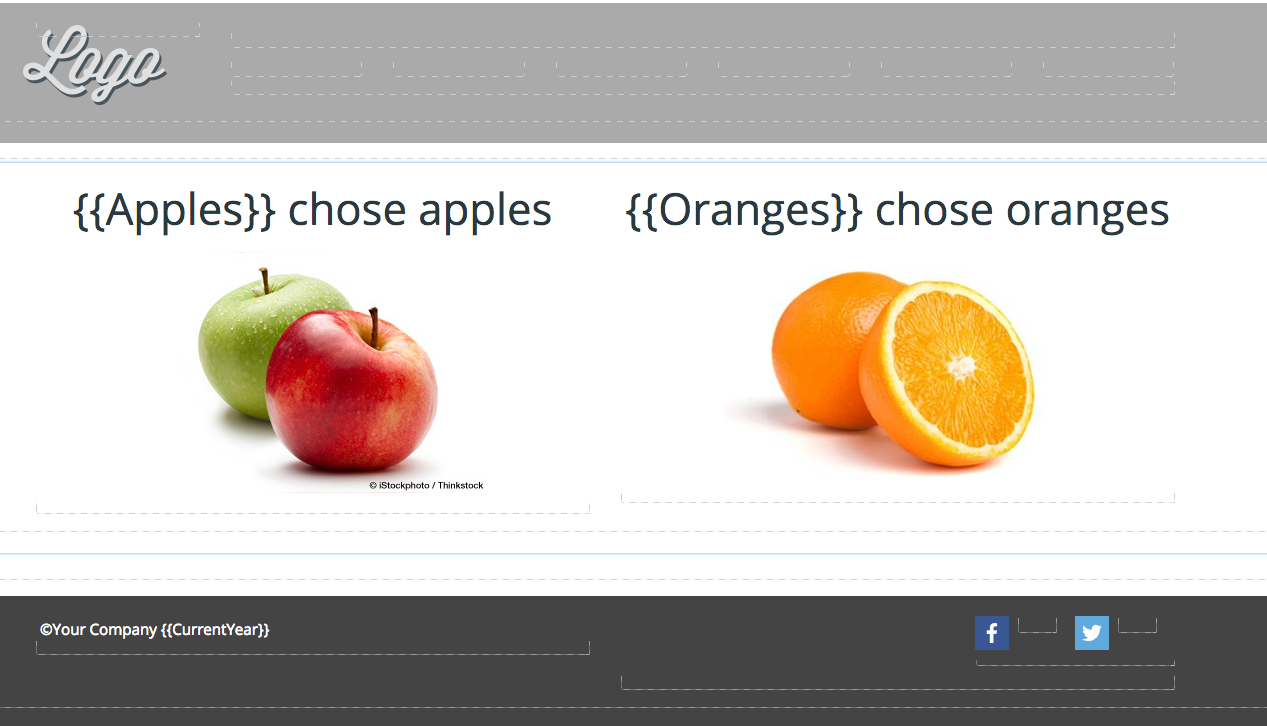
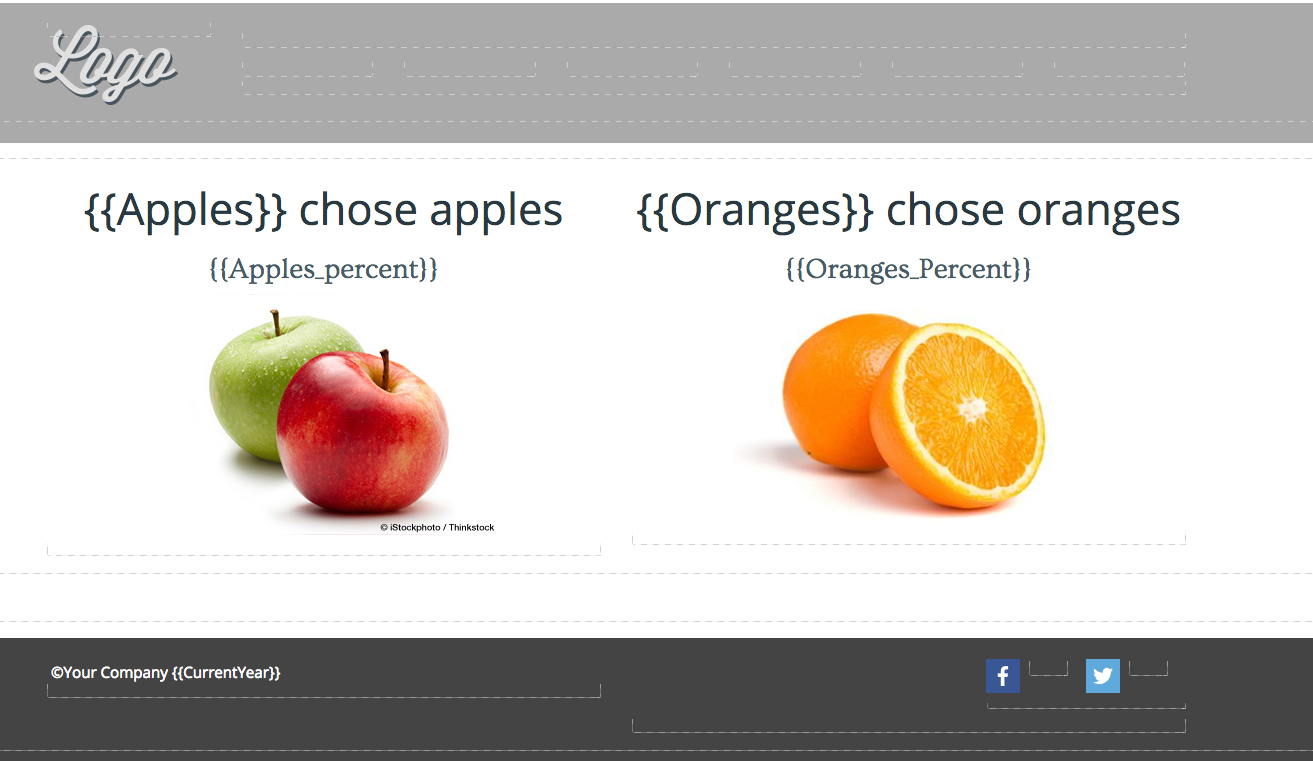
Content Variables
Now that your rules are set up, you may add content variables to your page to display the data saved to the Apples and Oranges fields. For more information on content variables, click here.
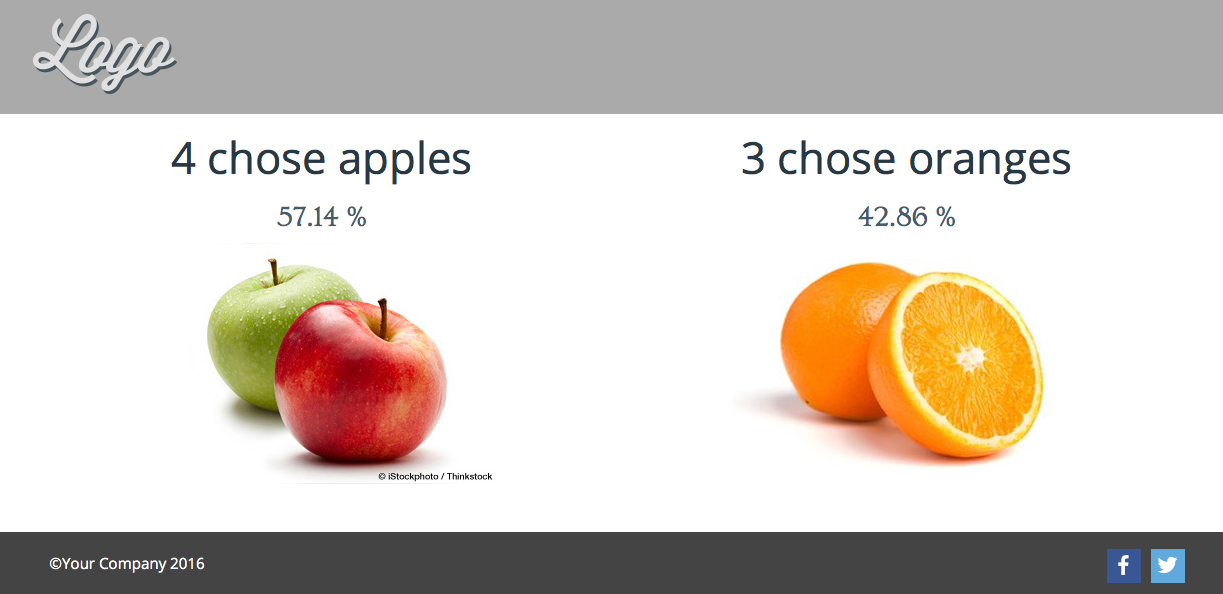
Testing
After setting up your lookup table and creative, you can start testing! To do that, all you need is a URL. Each time you make a selection, you will see the count increase for the corresponding selection.
Percentages
If you would prefer to show percentages instead of a total, you can add a few more actions to your rule. The next action will add Apples and Oranges together and save them to a Total field using the “Save computed data” action.
Next, add actions that will divide each field by the total using the “Save computed data” action. These actions can be set up to either overwrite the original value saved or you can create a new field to save a separate percentage value. In our example, we are saving data to separate fields so the total and the percentage can be shown on the page. Our percentage fields are called Apples_Percent and Oranges_Percent, respectively.
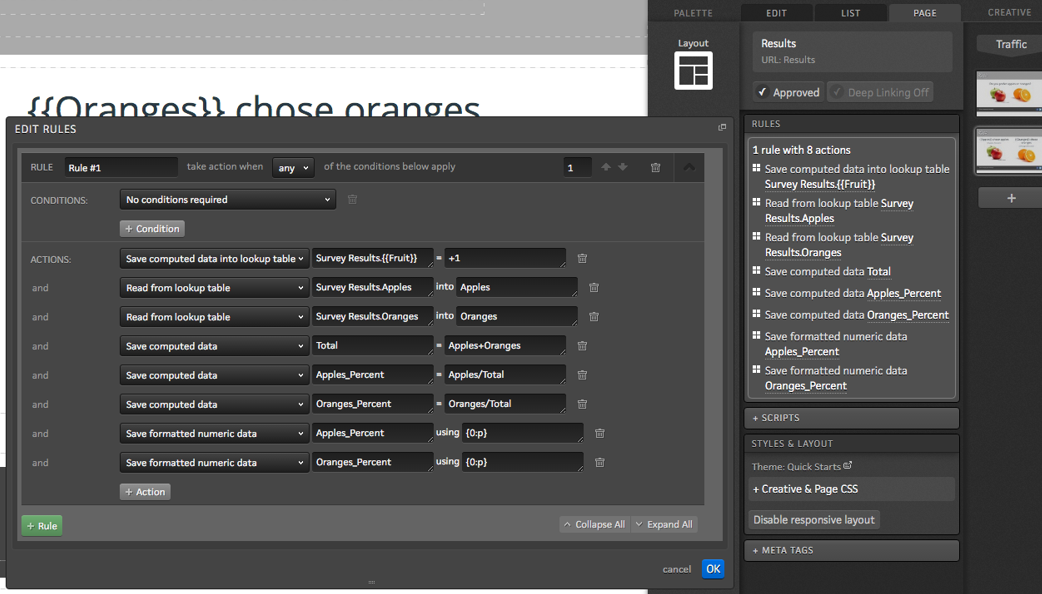 Finally, add two more actions to format the data as percentages using the “Save formatted numeric data” action. For more information on formatting numeric data, click here.
If you are using separate fields for the percentages, add corresponding content variables to your page and you will be all set!
If you have any questions, please contact us at help@rockcontent.com. 😀