.png?height=120&name=rockcontent-branco%20(1).png)
Your ion platform allows you to track clicks of elements on your pages by implementing Tags. When reviewing your Performance tabs, you will find this information within the Tag Cloud and Tag Table
In order to ensure you are receiving the maximum amount of value possible from your Tags, there are a few best practices you will want to keep in mind:
- Tag everything
- You will want to tag anything and everything that a respondent can click. This will give you ultimate insight into what clicks are driving your conversion rates and see what respondents are interacting with the most;
- Tags are picked up after an action is taken or a click is made. As a good rule of thumb, we would recommend applying a Tag that is relevant to the action being taken or the destination they are taken to after making the click.
- Be descriptive but concise
- To ensure you can easily identify who has clicked what within your tag gauges, you will want to make sure the tags you use make it easy to identify what that tag represents. For instance, if you have a “Buy Now” button on your page, you will likely want to use “Buy Now” as your tag.
- By making sure your tags are descriptive and concise, you will be able to quickly review your tag gauges and easily identify which clicks are helping your conversion rate the most.
- If you have similar destinations on a given page, you will want to make sure these clicks are uniquely tagged. For instance, you may have similar tab links as your footer links. In this case, you would want to differentiate the microsite tab tag from the footer link tag for reporting purposes.
- Tags do not need to be unique for every creative
- Because reports can be viewed for individual creatives, you can use the same tag in multiple creatives and still be able to easily see how clicks to that tagged element affected your conversion rate.
How to Tag
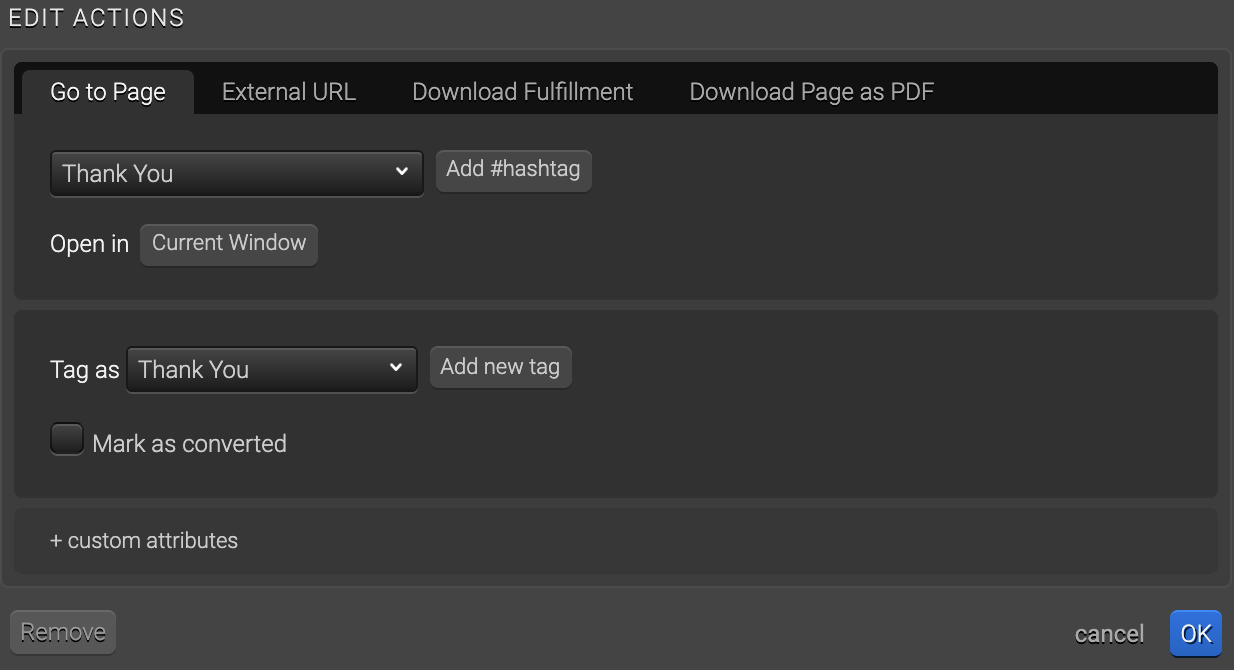
Now that we have discussed some tagging best practices, you may be wondering, “how do I apply a tag?” Anything that can be clicked can be tagged as well for tracking purposes. When adding an action to a given link or form, you will see the “Tag as” option.
To add a tag to your link, simply select one of the tags available within the dropdown menu from your tag library. If you would like to create a new tag, simply click “Add new tag.” When you click ok, your new tag will be automatically saved to your tag library and available in the dropdown menu for any link you publish in the future.
Reporting
When reviewing your Performance tab, you will find several gauges that will give you great insight into the tags that are being picked up by your respondents.
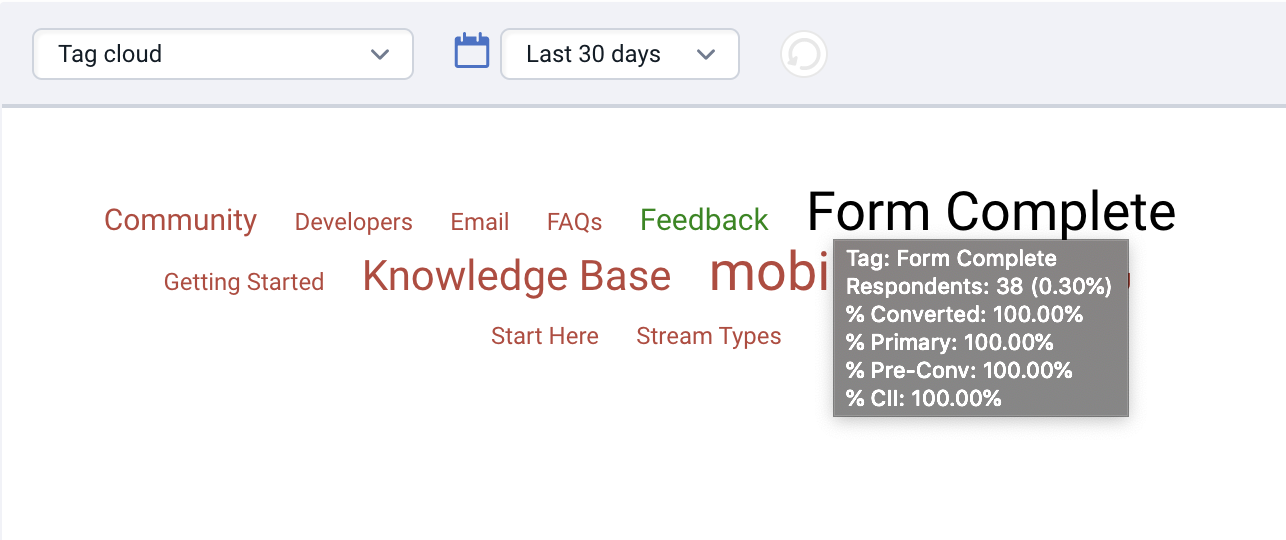
One such gauge is the “Tag cloud.” This gauge shows a visual representation of all tags that are picked up by your respondents. They are color coded so you may see which tags are underperforming (red), which tags are converting at the average conversion rate (blue), and which tags are resulting in higher than average conversions (green). You may also hover over a tag to view addition information.
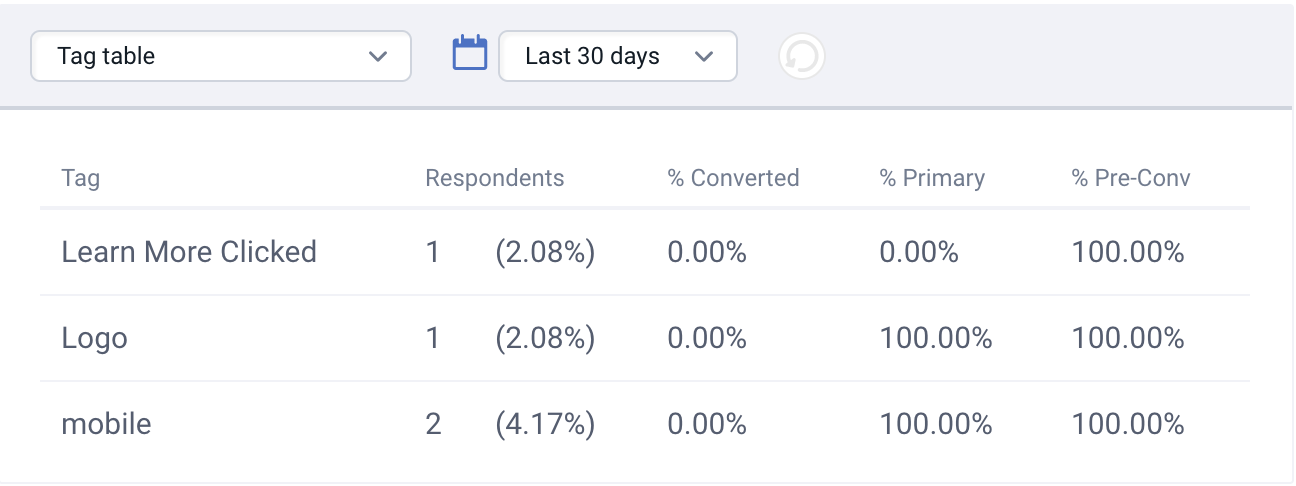
You can also view this information within the “Tag Table.” The Tag Table will show you how many respondents picked up a given tag, how many of those respondents went on to convert, the percentage of those respondents who picked up a given tag first as well as the percentage of those respondents who picked up a given tag before converting.
Your tags also play a role in your segmentation rate. When a respondent picks up his/her first tag, they are “segmented” into that tag. Your segmentation rate is a great way of determining the level of interactivity your respondents have with your page as it indicates they are engaging with it by clicking a tagged element.
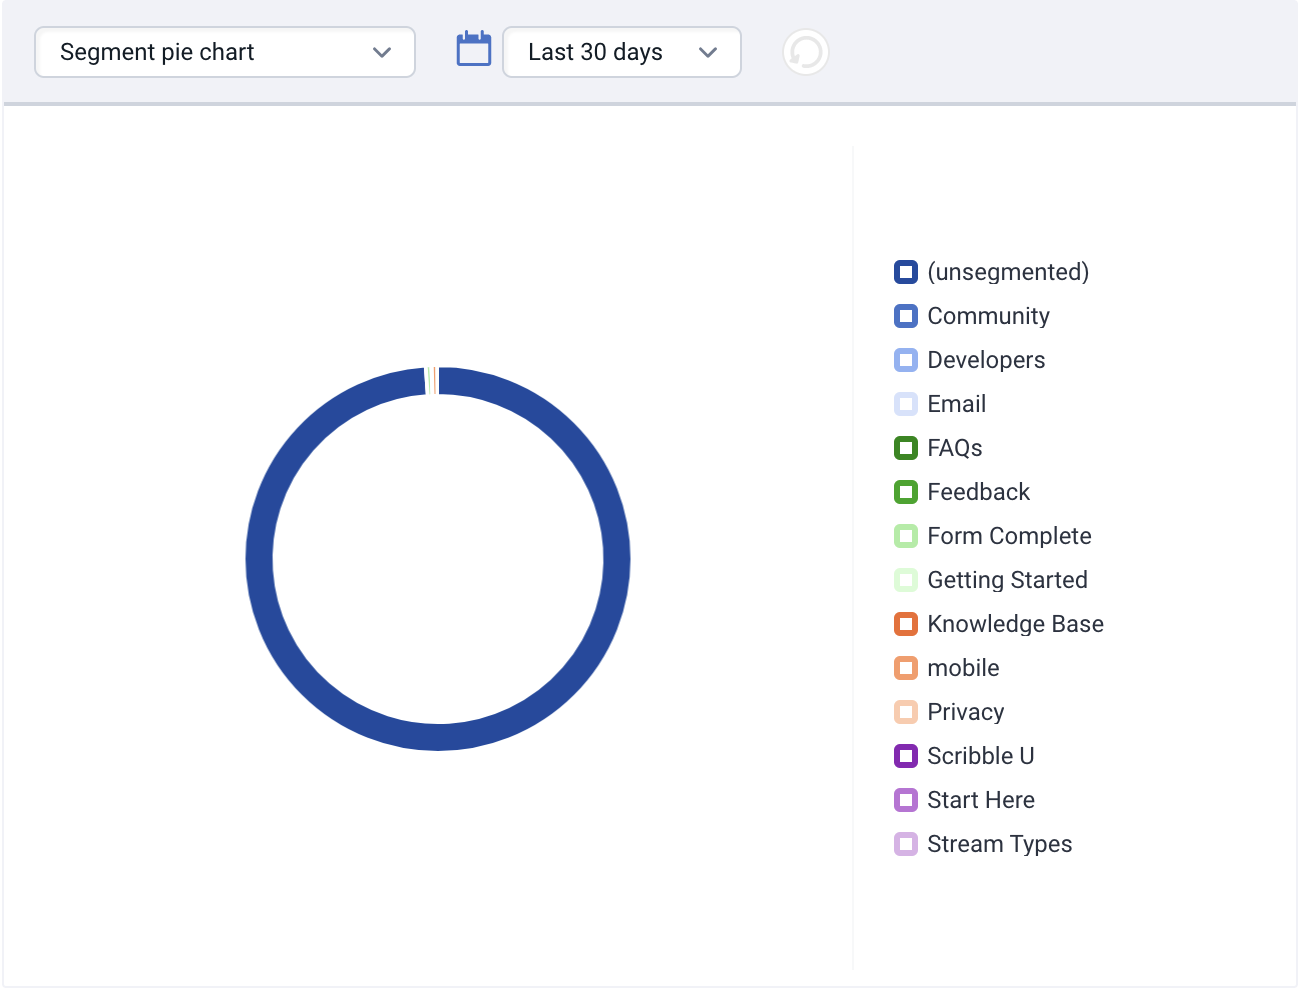
To view more information on your segments, you may review the “Segment Pie Chart.” This chart shows what percentage of respondents have segmented into the tags that are being picked up first. Respondents who do not pick up a tag before leaving the page are considered “unsegmented.”
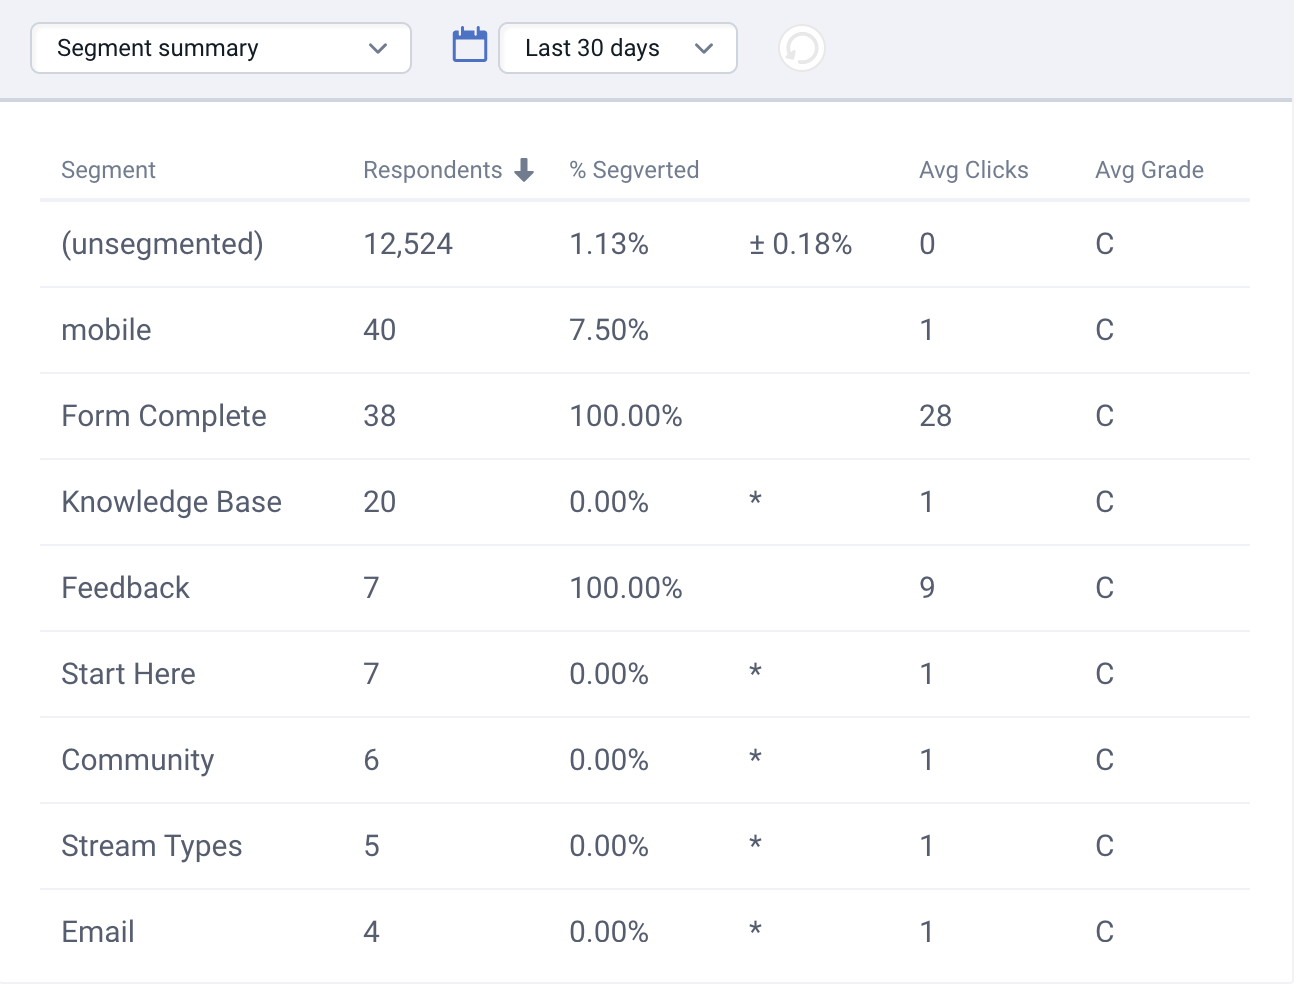
Your segments can also be reviewed in the Segment Summary gauge. Similar to the Tag Table, the Segment Summary gauge will list out more details of your segments. Within the Segment Summary gauge, you will find information on the number of respondents who segment into a given tag, the percentage of those respondents who convert (aka “% Segverted”), the average number of clicks to a given tag and the respondent’s average grade associated with that segment.
Ion now has a new feature to optimize the usage of Tags, the Tag Map! Learn more in this article 😀