.png?height=120&name=rockcontent-branco%20(1).png)
Reporting in the Ion platform is provided in two different manners—performance tabs and reports. Your performance tabs can be used to review real-time reporting metrics for any portfolio, campaign, creative or traffic source in your console.
You can also create reports that can be downloaded from your platform and shared with other members of your team. The reports you create can also be automated so they are sent to your inbox on a regular basis.
Performance Tabs
In the top-right corner of your portfolio, campaign, creative and URL management screens, you will see a tab to review performance metrics at that level.
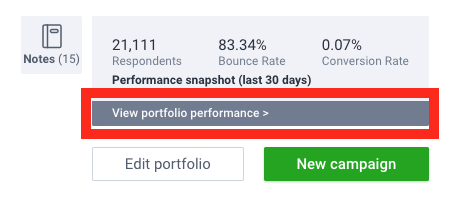
We call each unique performance metric a gauge. While many of the same gauges can be found at all levels, there are also gauges that are specific to each level.
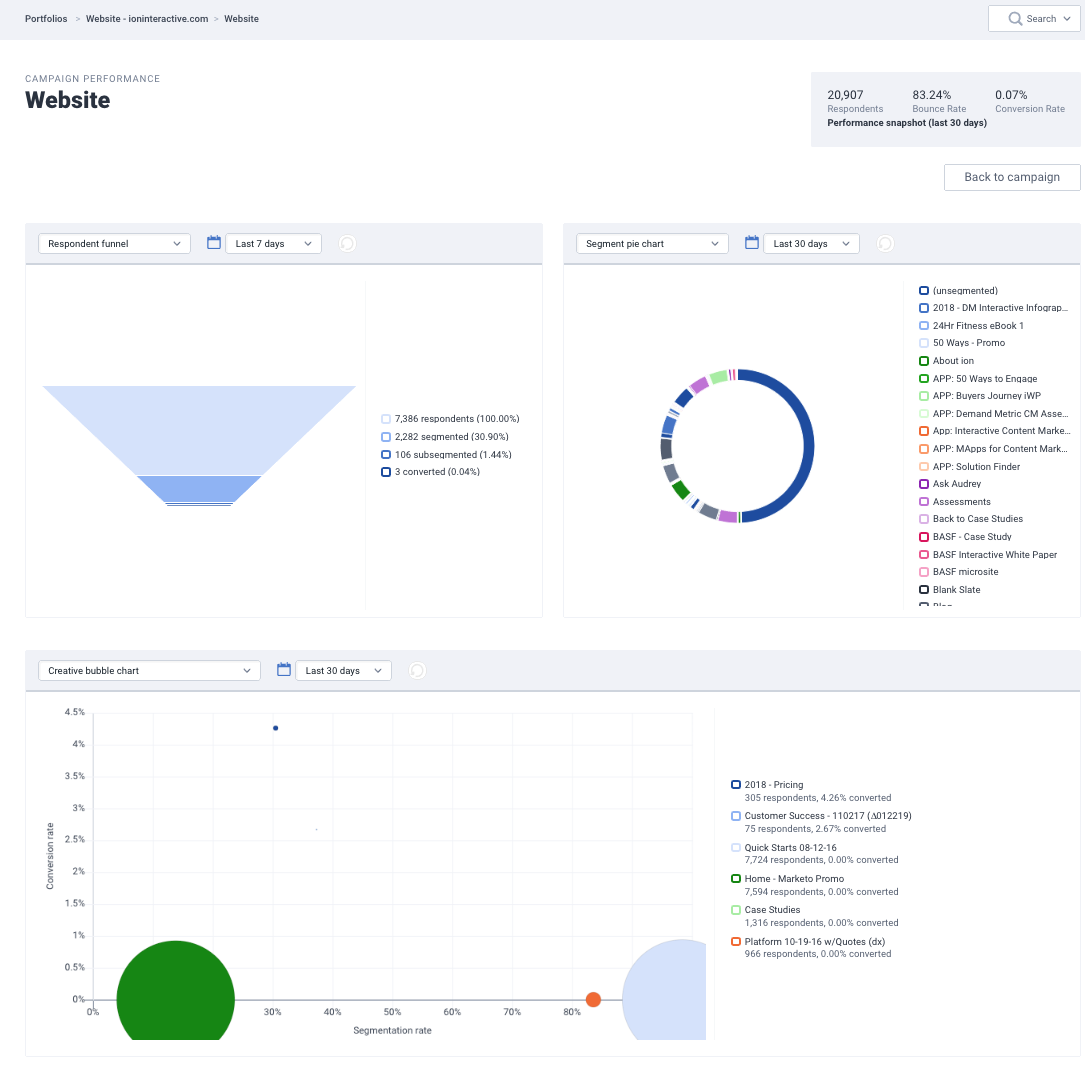
On any performance tab you will typically see three gauge sections—two smaller and one larger. You determine which gauge to display in each section of the page from the drop-down menus available. From within a given performance tab, select the gauge you would like from the gauge drop-down menu and click the blue refresh icon located directly to the right.
Reports
In addition to the many gauges available within your performance tabs, the Ion platform also gives you the ability to run reports that can be saved and automatically sent to your inbox!
To get started, click the reports tab at the top of your screen. Next, you can click the green ‘+report’ button to create a new report. From here, you may select the scope (i.e. system-wide, portfolio, campaign, creative, or traffic source) of the report you are looking to run. Next, choose one of the following report types:
- Summary: A handy PDF format that shows a compilation of key performance gauges and charts from your Ion console.
- Source & Creative Drilldown: Formatted for Excel, this report includes multiple tabs to see respondent, segmentation and conversion data by traffic sources and path, starting with a summary tab. Plus an extra perk—you can view stats of specific tags and/or data fields.
- Suspicious Clicks: Also formatted for Excel, this report identifies clicks from web crawlers or bots that may warrant further investigation.
Once your report scope and type is selected, you can choose any of the time periods available within the corresponding drop-down menu or enter a custom date range.
Before you click run though, you also have the option to save the report and have it automatically sent to your inbox. To do so, simply give your report a title, select how often you would like the report to be generated and delivered to you, and enter your name and email address. You can also click the ‘+email’ button to add more people to the distribution list of this report. When you click save, this report will be sent to you automatically with your settings.
When you click run, you will see your report displayed on the next page. At the top of the page, you will see a blue refresh icon that you can click to download the report as either a PDF or Excel spreadsheet, depending on the type of report you are running.