.png?height=120&name=rockcontent-branco%20(1).png)
Viewing an Overview of all Stream Analytics
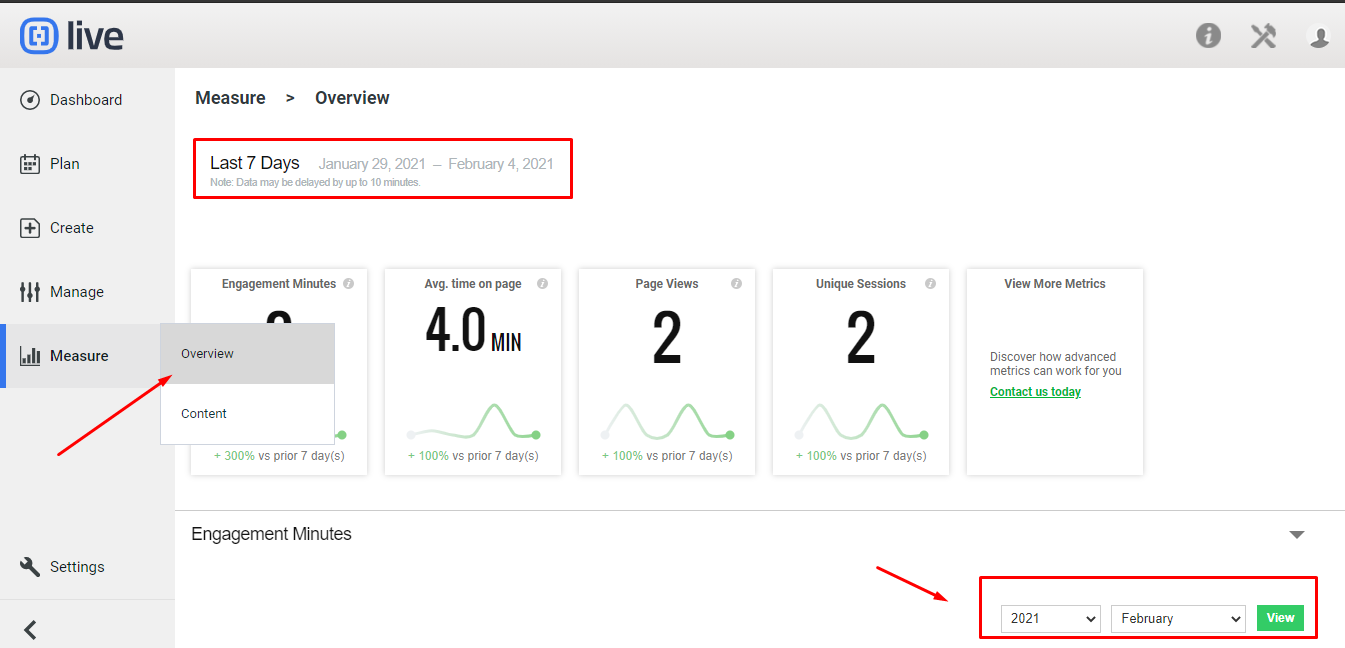
An overview of the data we collect about all streams created in your account is available on the Measure Overview page. These statistics are displayed pinboard-style, with smart graphs to easily visualize the general trend of each statistic from the previous day, or over a 7 day, 30 days, 90 days or custom time period.
Note: Data may be delayed by up to 10 minutes.
Navigation
Dashboard > Measure > Overview
Permission
Administrator | Developer | Editor | Moderator | Writer
- Go to your Dashboard.
- Click on Measure > Overview in the navigation menu at the top of your screen to view an overview of your streams’ analytics.
The smart graphs display a general trend of the following information about your streams analytics:
Engaged Audience
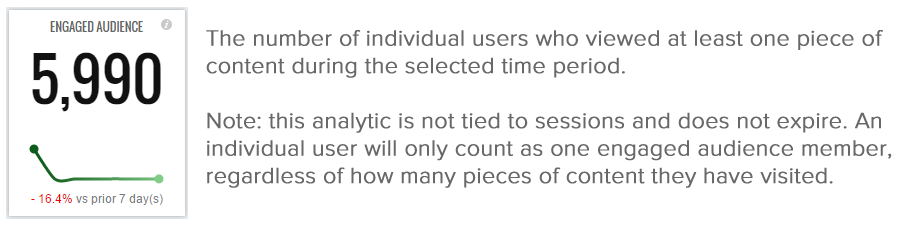
Engaged Audience = Watchers + Active Audience + Prospects
Active Audience
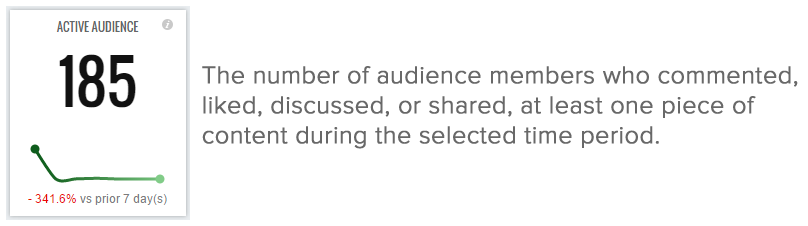
Active Audience = Audience that interacted + Prospects
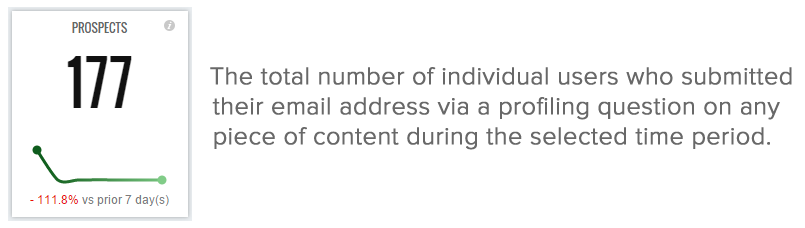
Prospects
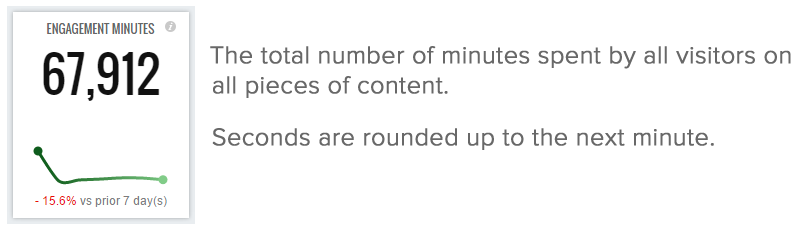
Engagement Minutes
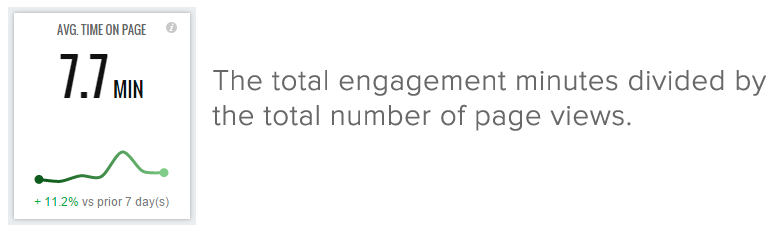
Average Time on Page
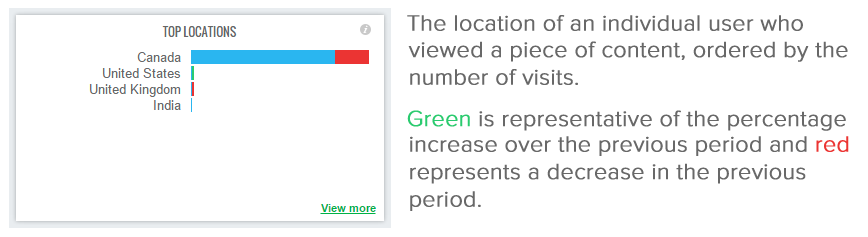
Top Locations
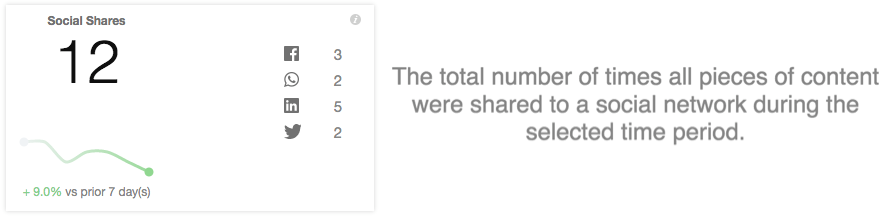
Social Shares
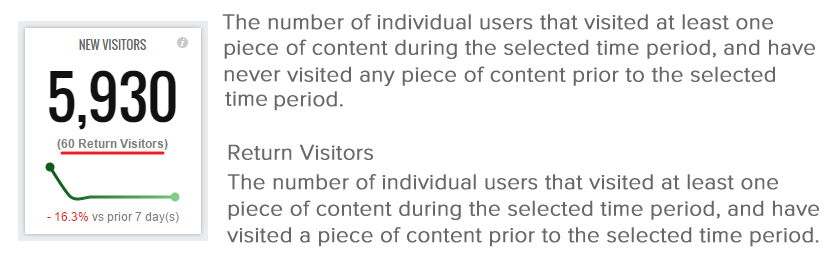
New Visitors, Return Visitors
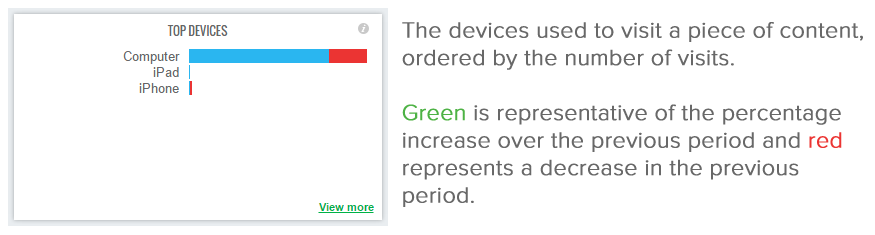
Top Devices
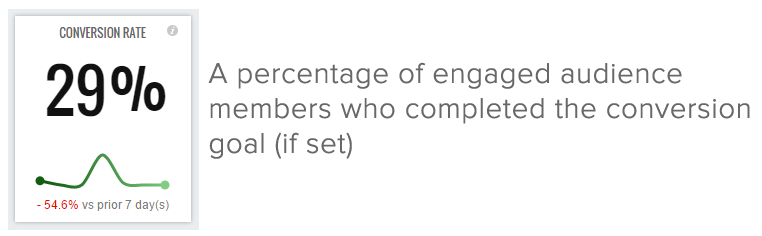
Conversion Rate
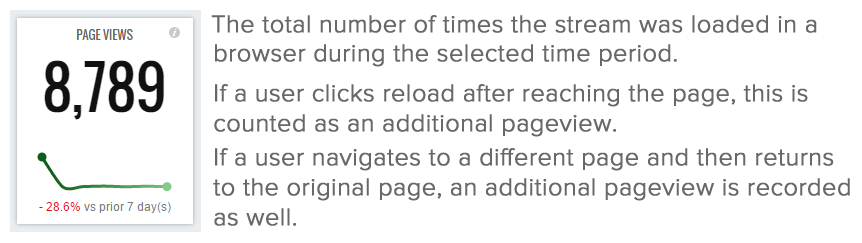
Page Views
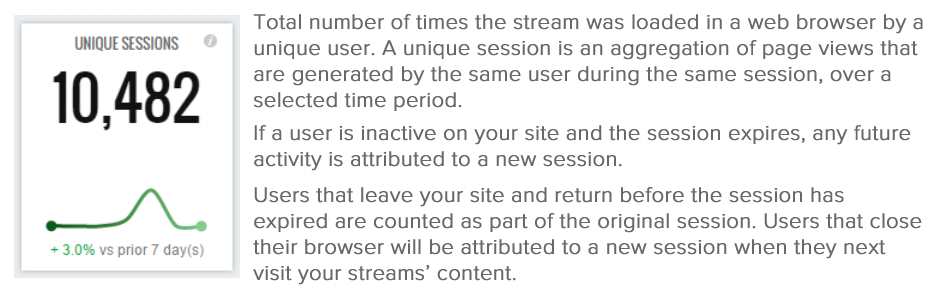
Unique Sessions
Top Performing Content By Engagement Minutes
Streams within your account that generated the most engagement minutes during the selected time period.