.png?height=120&name=rockcontent-branco%20(1).png)
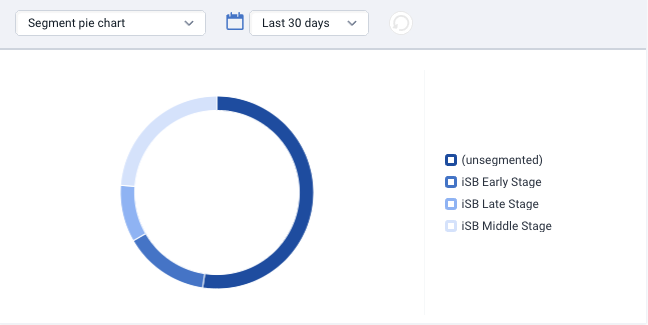
Segment Pie Chart
The segment pie chart provides a familiar way to view the percentage of respondents per segment, as well as the percentage of unsegmented respondents. You can think of your segmentation rate as a measure of engagement between your respondents and the page you have built. In the ion platform, segmentation occurs when a respondent lands on one of your ion pages and takes an action that has been tagged. Your "unsegmented" percentage represents those respondents who left the experience without taking a tagged action.
Segment Summary
Segment summary is a detailed view of segmentation within a given portfolio, campaign, creative or traffic source. Segmentation is a measurement of engagement. In the ion platform, respondents "segment" into their first tagged action. If they leave the experience without clicking a tagged action, they will be marked as "unsegmented."
The segment summary gauge will show how many respondents, within a given period of time, segmented into each tag. It will also show the percentage of total traffic that segmented into that tag, the percentage that segverted, the average number of clicks to that segment per respondent as well as the average grade of respondents who segment into that tag.
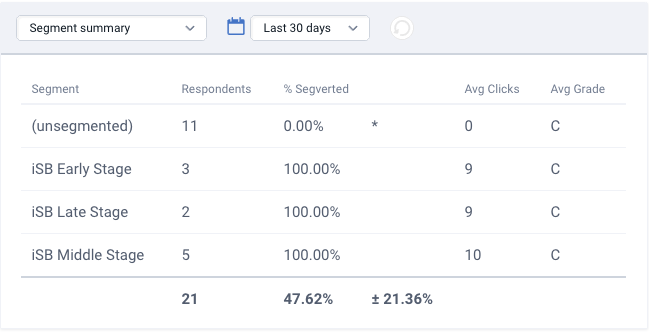
* The segversion rate is the percentage of segmented respondents who also converted. The +/- percentage denotes (with 80% confidence) that the segment will continue to convert at that rate plus or minus the percentage shown. If you do not see a segversion rate, then it has not reached statistical significance yet.
If you have any questions, please contact us on help@rockcontent.com. 😀