.png?height=120&name=rockcontent-branco%20(1).png)
See how the number of pieces created and reworking carried out in your agency is by using the index of reworking.
Reworking Indexes must be monitored by managers. This is because reworking affects not only the progress of activities, but also the financial profitability of your agency. Reworking represents the real villain of your day to day.
With that in mind, we developed the Monthly Reworking Indexes Report. With it, you can see the number of reworking and the total number of pieces made for a given client and/or project. From these two pieces of information, the monthly index of reworking is calculated.
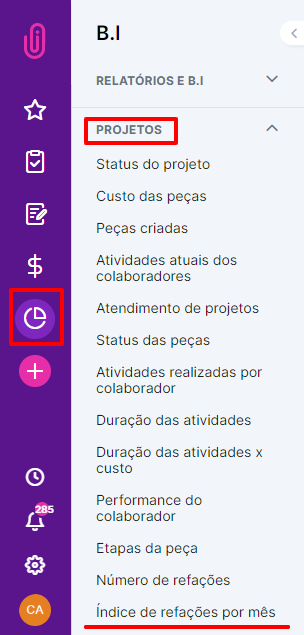
To access it, go to Reports and B.I. > Projects > Monthly Reworking Index
The screen will open blank. To find the information you want, use the filter fields. It is possible to select the desired period, the customer and/or the project.

From there, the system will show a graph with information compatible with the selected filters. To view the values, just hover over the bars or the line.
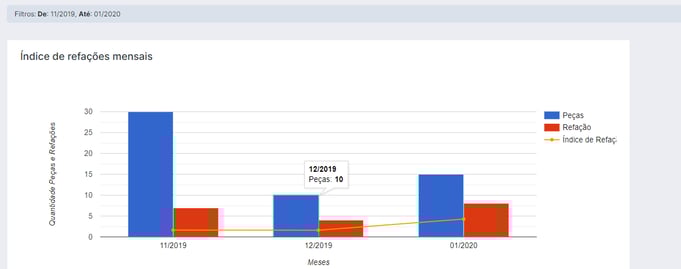
The blue bar represents the pieces, the red bar represents reworking and the orange line is the reworking index.
The index is calculated as follows: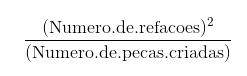
You can print the report in .pdf. To do this, use the printer icon in the right corner of the screen.
Monitor the whole process and see how easy and practical it is to access this information!
Now you can control your agency's reworking index and lower your costs!
Was this content helpful to you? Leave a comment in the information box below!