.png?height=120&name=rockcontent-branco%20(1).png)
- Rock Content Knowledge Base
- Studio
- Reports and Indicators
How to evaluate sales indicators by quarter
Do you have the habit of analyzing your agency's sales indicators? No? This is a very important thing to do!
These indicators relate to Internal Cost, Commissions (media, S.O, fees) and Monthly Fee, that is, everything the agency sold per quarter.
The way to this report is: Reports -> B.I. -> Sales Indicators. The screen will appear blank, and to generate the results, you must define the search period in the filter:

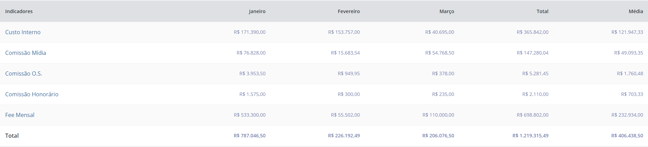
From there, you will have information about the values of each indicator by quarter, month by month, with the total and the average per period.
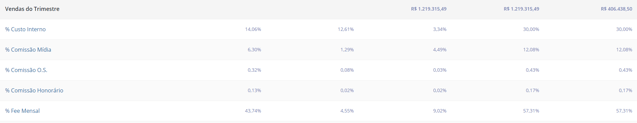
You will also see the total sales data for the quarter and the percentage represented by each indicator:
And lastly, the detail on the service productivity concerning the "creation/approval of proposals":

You can print the report in PDF or generate an Excel version. The buttons for that are in the upper right corner 😊

This is yet another way to analyze data that will help you plan strategies to sell more, attract more customers, learn which sales come from your highest percentage of profits and much more. Share this article with others in your agency! 😉
Did you find your answer?