.png?height=120&name=rockcontent-branco%20(1).png)
- Rock Content Knowledge Base
- Studio
- Reports and Indicators
How to compare Planned vs. Accomplished media values
Understand how and why to use the Planned vs. Accomplished Planning on iClips.
For efficient media investments management, iClips provides a comparative report of the planned values versus the values accomplished. This feature can also show the amounts invested in each vehicle in a certain period, customer, project, and other filters available.
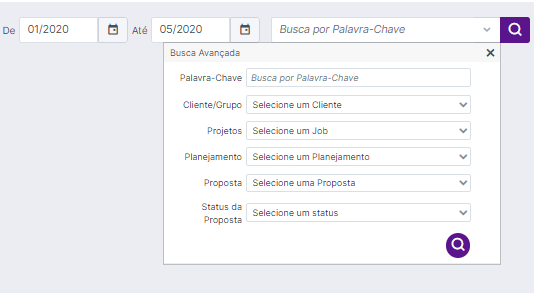
To do this, go to Contracts Menu > Reports > Planned vs. Accomplished Planning. The screen will open blank. To generate the results, you can use the date fields or refine your search using the advanced search features:
After completing the search, the system will display a graph whose bars colored in blue represent the values accomplished, and the yellow bars represent the remaining values; the sum of the two is the planned value. See that the values are separated by media type:

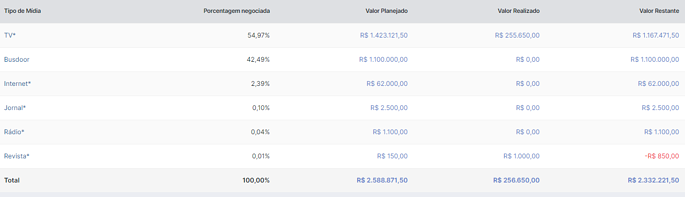
Just below this graph, you will see the information in table form:
And, for greater detail of each amount invested, you will have other graphs located at the bottom of the screen that distinguishes the amounts invested in each vehicle (separated by media type), as shown below.

To view the information, click on each arrow to open the chart by media type, as shown below:

You can print the report in PDF or generate the Excel version. To do this, use the purple icons in the upper right corner of the screen.

Still need help? Just call us at help@rockcontent.com or on the platform chat, and we will help you!