.png?height=120&name=rockcontent-branco%20(1).png)
The ion confidence interval gauge will help you understand the statistical confidence of your A/B tests and when your A/B test has reached a test winner. You can use automatic optimization to allow ion to automatically recognize when your test has a winner or you can use the creative confidence interval gauge to monitor your test and declare a winner manually.
Note: Have you set your testing statistical significance level? To do so, hover over the Settings tab and select “Configure Site.” At the bottom of this page, you will see a dropdown menu for statistical confidence. Select your preferred confidence level and click save.
Tracking Test Performance
To find the creative confidence intervals gauge, you may navigate into your test’s Traffic Source Performance tab. In the bottom half of the page, select “Creative confidence intervals” then click the blue refresh icon directly to the right. Next, enter a date range that reflects when the test started. Once the appropriate gauge and date range has been selected, you should see a graph similar to the one seen below which demonstrates the current statistical data of an A/B test.
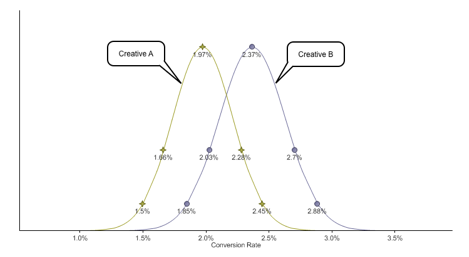
Each line represents a Creative that was live during that date range. Use each point on the curve to analyze your test performance. The point at the top of each curve represents the mean conversion rate of the Creative. In the example above, the mean conversion rate, is higher for Creative B (2.37%), and is performing better as a trend.
Moving down a given curve, you will notice additional points. Because ion uses binomial distribution, the points on the left and right side of a given curve represent the same level of confidence with the space in between representing the margin of error. The first point on either side of a given curve represents 80% confidence and the next point represents 95% confidence. Once the lower-bound point of a given curve passes the upper-bound point of the other, a winner of the test can be declared at that level of confidence. For instance, if Creative B’s lower-bound point at 80% confidence passes the upper-bound point at 80% confidence for Creative A, Creative B can be declared the test winner.
If the traffic source is set up for manual optimization, you can monitor test results and stop sending traffic to the underperforming creative when you are ready to declare a test winner by removing from the traffic source weighting. With automatic optimization set up, ion will automatically stop sending traffic to the underperforming creative once confidence is reached.
If you have any questions, please contact us on help@rockcontent.com. 😀