- Rock Content Knowledge Base
- Ion
- Performance and Reports
Traffic Chart
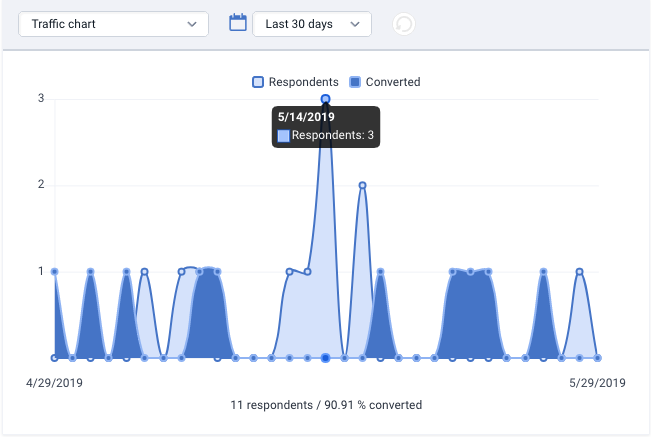
Traffic chart shows the flow of traffic over a given period of time. The traffic chart will show trends for both your non-converted respondents (light blue) as well as your converted respondents (dark blue). This gauge is available within all portfolio, campaign, creative and traffic source Performance tabs. You can also hover over the points within your traffic chart to get an exact value for that point in time.

If you have any questions, please contact us on help@rockcontent.com. 😀
.png?height=120&name=rockcontent-branco%20(1).png)