.png?height=120&name=rockcontent-branco%20(1).png)
Average time spent on each asset: a revolutionary way to support your project management
An essential part when organizing a project is to evaluate how much time will be spent to finish it, right?
Now, Studio can automatically calculate the average execution time of all assets performed on the platform.
Estimated time
If you work as Client Services/Traffic manager and want to include this information in more detail, you can include it when appointing a task owner:
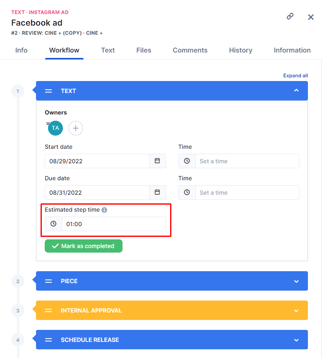
Average Time
According to the executions, Studio will automatically calculate and display the average performance time for visualization in the asset templates (settings > asset templates):
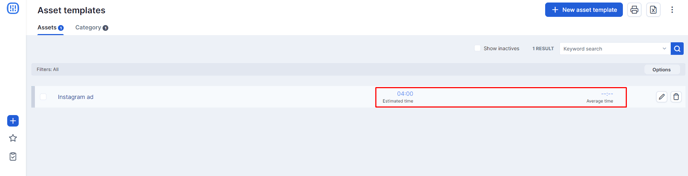
The time takes into account all the steps and their respective execution durations, in addition to considering possible redoes that may happen.
The average time is only updated on the asset template screen when someone completes an asset using this template in a project. If the asset is not finished, this value is considered null.
It is important to note that the estimated time is not linked to the automatically calculated average time.
The user must enter the estimated time manually. The objective is that:
- The average time helps you understand the general execution situation of these assets.
- The estimated time allows you to work on this indicator to improve it and share delivery expectations with the rest of the team in an easier way.
How does this impact my project?
Ok, we have an average time calculated automatically in Studio and an estimated time calculated manually. How does this impact our projects?
Studio will always prioritize the estimated time, manually set by the user when calculating a project's total time. What does that mean?
If the asset template has an estimated time, it will be taken into account for the project calculation. If the asset's estimated time does not exist (that is, none of the asset's steps has an estimated time), the average time is considered for the calculation.
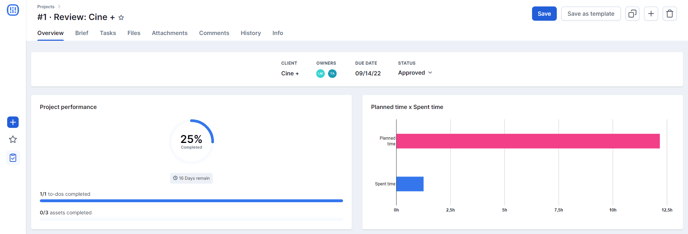
Planned Time vs. Spent Time Chart
With these new features, it's possible to visualize and compare the project's estimated time and the time already spent. That is another way to monitor the progress and understand if it is necessary to take any action to guarantee delivery on time, for example:
Still need help? Simply reach us at help@rockcontent.com or through the platform chat and we will help you!