.png?height=120&name=rockcontent-branco%20(1).png)
- Rock Content Knowledge Base
- Ion
- Performance and Reports
Day-Parting Summary
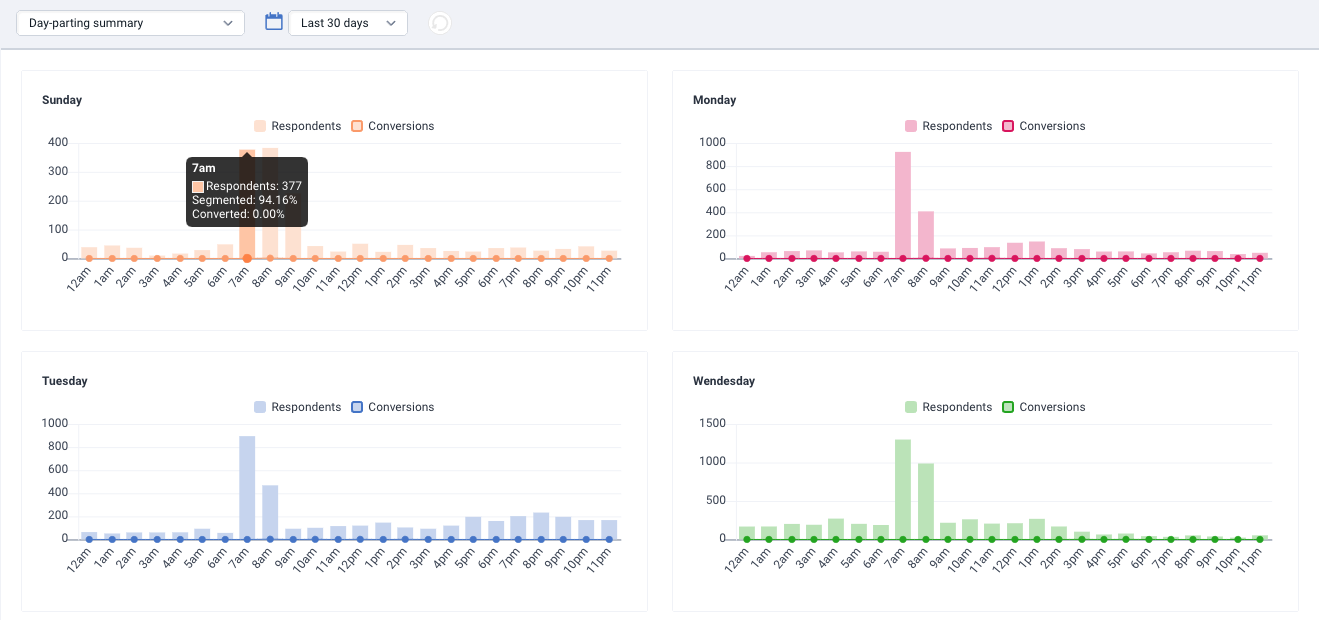
Day-parting summary offers a great way to view traffic and conversion trends over the course of a week. This gauge is available on the performance pages for portfolios, campaigns, creatives and traffic sources—just select ‘Day-parting summary’ from the gauge dropdown at the bottom of your performance page. The day-parting summary gauge displays both the number of respondents (in a bar graph) and the conversion rate (in a line graph) for each day of the week as well as for each hour of the day during the specified date range.
For example, if you specify a 30 day time period, the values displayed on Monday, 11am will be the total number of respondents as well as the conversion rate for all respondents that visited a path on a Monday between 11am and noon (but not including noon). You may also hover over the bars on the respondent bar graph or the circle markers on the conversion line graph to see the # of respondents, segmentation rate and conversion rate for that hour of that weekday.
If you have any questions, please contact us on help@rockcontent.com. 😀